Measuring Success in data Science
10 Jul 2022TL;DR: Success in data science is inversely proportional to the number of times the same steps are repeated.
Gartner says 85% of the big data projects fail (1). They also say only 20% of the analytics insights deliver business outcomes. VentureBeat says 87% of data science projects never make it to production (2). Reading these two statistics, two thoughts come to mind: 1. Why are the failure metrics so high in data science? And 2. Is it apt to use failure metrics for measuring data science projects?
If an inventor conducts 100 experiments to build the first light bulb and 99 of them fail, is it okay to set this inventor’s failure rate as 99%? Is it okay to measure an inventor’s performance on the same metric as an airline whose flights are failing to arrive on time? I don’t think so.
Data science is experimental. It’s not as deterministic in nature as flight arrival times are. And just like any other sciences, it requires a set of explorations to determine if a result is achievable. Even if we want our ML models to be 99% accurate, we cannot prescribe a foolproof path to this result prior to explorations. Through the explorations, an experimenter might discover that such a path is not possible. This indeterministic nature of data science leads to several unsuccessful paths which contribute to the perceived high failure rate. Due to this experimental nature of data science, the failure rate metric does not satisfactorily measure the failure.
There is a better way to measure DS failure. It starts with defining success. And then, Failure = 1 - Success. Basically, anything that is not a success is a failure. This simplifies the definition of failure and pins it on Success. Now let’s define Success.
Success in data science
Defining Success can be tricky, since it comprises more than just discovering a successful solution to the problem. If it’s dependent only on discovering a successful solution then measuring success is no different than the failure definition used by some of the publications mentioned earlier.

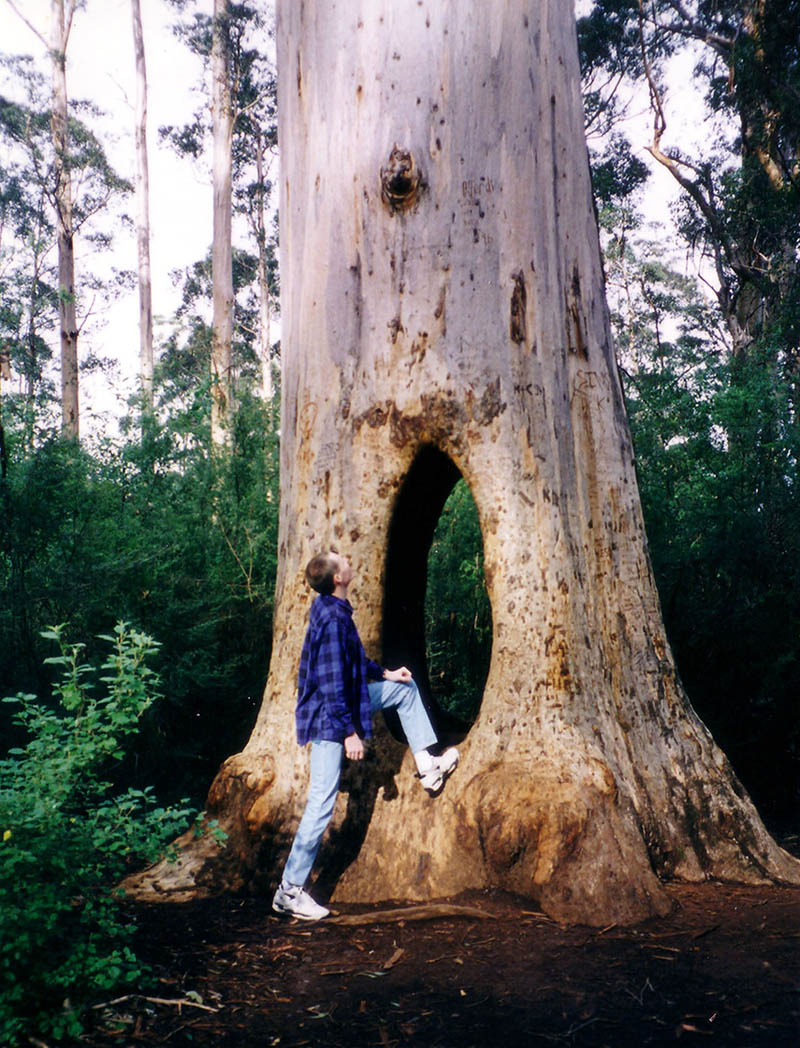
Start of a data science project can be considered as walking ground up the trunk of a tree. Every branch of the tree can be considered a possible path to the solution. In our analogy, a project may be completed by reaching the flowers. However, flowers are not on every branch; they may not even exist on the tree. Before beginning the exploration, we don’t know if there are flowers (no known solution to the problem) on the tree. In many cases, we will have to explore the entire tree.
What will be the factor for success in this scenario? Time - amount of time spent exploring the tree and determining where flowers are located. If we can explore the tree at the theoretical lowest time limits then we can show that we are successful in our endeavor of knowing if flowers exist on the tree. Even if the results show that there are no flowers on the tree, we are still successful.
Data science projects are just like the tree exploration described above. Some paths lead to flowers (end goal) yet many lead to flowerless branches (not a viable solution). Just like tree exploration, the success should be measured in terms of time taken for exploring the different paths. We are successful in exploring a branch, if we take the shortest possible time. The results of the exploration don’t matter. The time taken to explore that should decide the success or failure of a DS project.
Exploration seems straightforward in a tree - walk and mark the branches. But it’s complicated in real Data Science projects. Certain paths have to be re-explored. It could be due to a recently found anomaly in the training data or a change in the business requirements, or sudden demand of higher precision from stakeholders among umpteen reasons.
As Data Scientists, to be successful, our goal should be to minimize these re-explorations.